Yellow Starbursts

Today we worked on Yellow Starbursts, a 3 Act Math lesson by Dan Meyer.  You can find the activity here.

We began by watching the following video.

http://threeacts.mrmeyer.com/yellowstarbursts/act1/act1.mov

When it was over, I asked the students to write down one question they had about the video.  We discussed the questions as a class.  After writing down all the questions I told them we would be trying to figure out how many of the packets had 2 yellow starbursts and how many would have 1 yellow starbursts.

Then I asked the students what else they needed to know to find the solution.  They said they would need to know if yellow starbursts had the same frequency as the other colors.  I then showed them the picture with the starburst frequencies.  Students then worked in groups to complete the problem.

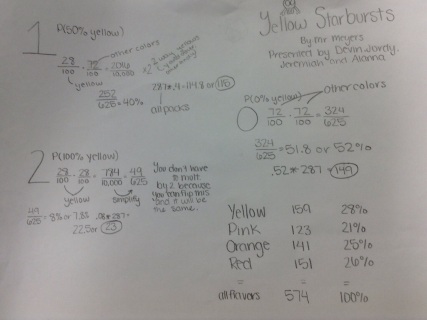
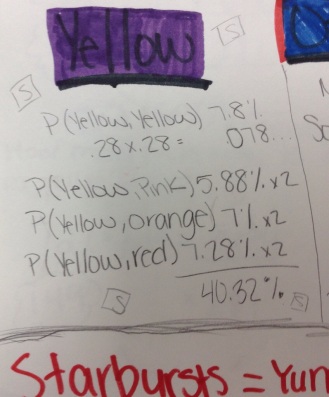
They had some really great approaches.  Most groups used the probability of compound events, but they had different ways of going about it.  Finding the number of packs with 1 yellow was the hardest.  You can see some of their approaches to this below.

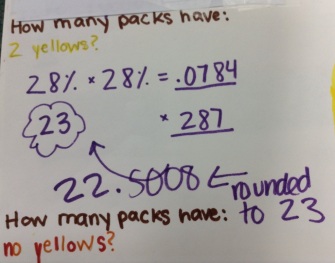
2 Yellows:

20140603-104600-38760902.jpg

1 Yellow:

20140603-104602-38762952.jpg

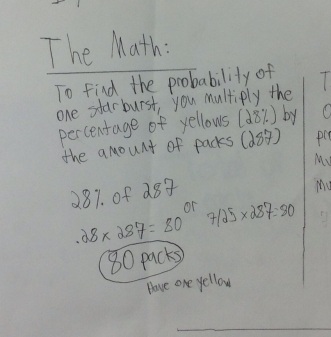
The group below made a very common mistake.  To find the number of packs with one yellow, they took the probability of yellow (28%) and multiplied this by the total number of starburst packs (287).  This led to a really nice discussion of why this doesn’t work.  We also talked about what we could salvage from their work and what we needed to change to correct the issue.  They had correctly found the number of double yellow packs to be 23.  The 80 packs they found represented 160 yellow single starbursts.  We took 46 away from that because 46 yellow starbursts were already taken in the double packs.  This left us with 114 yellow starbursts which must mean there are 114 packs with 1 yellow since we can’t put any of them together because we already did all the double yellow packs.  I thought this was a really cool approach to the problem.

20140603-104603-38763890.jpg

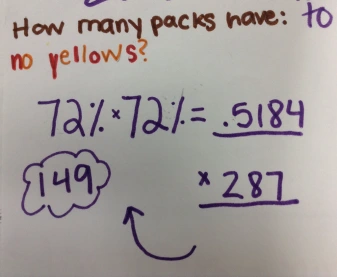
0 Yellows:

20140603-104601-38761909.jpg

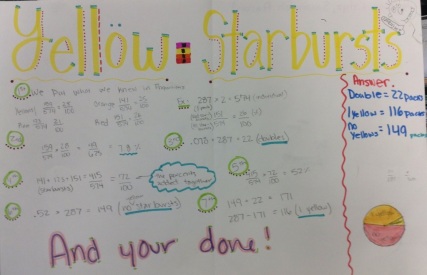
These groups did a really nice job presenting all of their work.

20140603-104559-38759968.jpg

20140603-104559-38759050.jpg


My First Three Act Math

Act 1: What is the probability that a contestant wins on their first attempt?

Act 2: What additional information is needed? (Rules – which are already given)

Act 3: What is the probability of winning the car after the contestant is told how many numbers are correct?

I did this with my 7th graders and it went really well. I paused the video at certain points to let them write down their guesses and questions. Each student wrote down their own guess for the price before I showed the contestant guessing. To solve they used tree diagrams to list all possible prices of the car. They also found the solution using compound probability.

This is my first attempt at creating my own three act math task.  I really like the idea I’ve got but I think the video is too long to really hook the students.  It gives away too much.  My thought is to cut the clip down so that only the portion of the video when the woman is making her guesses is played.  That would be Act 1.  For Act 2, when we go over the additional information that is needed, I could show the portion of the video where Drew explains the rules.  For the Act 3 extension, I would show the portion of the clip with the contestant asking the mighty sound effects lady how many were correct.  I really like this extension question because it has a nice connection to combinations.

Video

Barbie Bungee

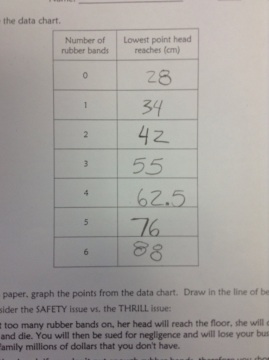
My 7th graders just finished learning about scatterplots and trend lines. I’ve heard lots of great things about the “Barbie Bungee” activity so I decided to give it a try with the class. I’ve never done this activity with students so there were a few things I would change the second time around.  Mainly the students had issues with deciding where to measure and how to drop Barbie, etc.  I didn’t give them much instruction with this because I wanted them to struggle with it on their own, but it did take extra time.  They collected data and recorded it in a table.

20140603-095115-35475445.jpg

I used a worksheet created by Fawn Nguyen. You can find her post here.  I really like how this activity can be modified for different levels. Using this with middle schoolers, we used trend lines to complete the activity, but you could use regression lines in algebra 1 classes.

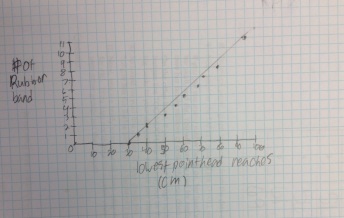
Many groups started by making a graph that did not allow them to extend out to 300 cm so they had to make a new graph.  An example is shown below.

20140603-095015-35415835.jpg

20140603-095016-35416940.jpg

One interesting approach I saw students do was to figure out how many rubber bands it would take to for 100 cm and then multiply that by 3.  The group below did that.

20140603-095114-35474486.jpg

This was our winning group!

This Barbie wasn’t so lucky! The estimate was so close though! Nice work to this group of students!


Is Homework Worth the Time?

The Problem

Each year teachers are asked to accomplish more and more within their school day. It often seems that there is more content to teach than there is time to do it. With the shift to the Common Core State Standards this year, I felt this more than ever. I am supposed to be teaching with a conceptual approach in mind. Students are supposed to not only be learning mathematical content but they should also be creating mathematical models to represent real-world situations. To me, this means that I need to be spending more time in class working on inquiry-based activities, discovering concepts, conducting simulations, making models and all those other wonderful teaching strategies that made me want to be a teacher in the first place! Sounds like a match made in heaven, right? Ummm… sort of? These activities take a lot of time! And time is not easy to come by as a teacher. I have been working to incorporate more of those great strategies this year, but now that I have made it to spring I am wondering, “How I will ever make it through the curriculum before June?!?”

So I started thinking about how I spend my time in the classroom. I teach 90 minute classes, which is awesome. But I don’t feel I use that time as efficiently as I could. For the most part, we cover a lesson/concept a day. If I want to add in an activity it spills over into the next day so we end up spending two days on that lesson. I have a hard time getting an activity AND notes done in one class period. If I can somehow find a way to accomplish both in one class period, I could do many more engaging and hands on activities. This is my goal.

I began tracking how I spend my time each day.

  • Warm Up (5 min.)
  • Good Things (5 min.)
  • Correct homework from previous day (1-2 min.)
  • Go over homework questions on the board (20 min.)
  • Break (5 min.)
  • Lesson notes (30 min.)
  • Work on new homework with partner (10 min.)

After thinking about each part, I decided the area where the most time was wasted is definitely homework. I assign problems out of the textbook for students to do as practice after each new lesson. We grade them the next day so they can see how they did. The assignment is entered as complete or not complete in gradebook. I usually work on 4-5 problems on the board that the students had trouble with. I also give the students some time to work on their homework at the end of class. I spend about 30 minutes a class just on homework! Can that time be better used on something else? Are the benefits worth the instructional time? Could my students’ achievement increase if I used that time another way? I’m not saying I want to throw out homework all together, but maybe there’s a better way to do it. Which leads me to my project…

The Research

As a project for my graduate class on secondary student issues, I decided to research the effect of homework on student achievement. From there, I will use what I find to help me rework my current model for assigning homework. Below are some of my findings that I found to be especially impactful and important in answering my questions about homework.

Which students benefit from homework?

  • Advantaged students: Homework has a significant positive impact on advantaged students but not on disadvantaged students. Because of this, when homework is assigned to a whole class, the achievement difference between advantaged and disadvantaged students becomes greater.  (Ronning, 2011)
  • White students: The impact of homework was greater on white students than black students.  (Eren, 2011)
  • I assume this is due to socioeconomic status disparities as well but researchers did not discuss this in depth.

  • Students with well-educated parents: Homework has a negative effect on students whose parents have a low education level due to the parents’ lack of ability to help the student. Students with well-educated parents show a greater increase in achievement from homework. (Ronning, 2011; Eren, 2011)
  • High ability students: Ability is strongly linked with achievement increase due to homework. Higher students improve more from homework than lower students. (Eren, 2011)
  • Older Students: Students in secondary classrooms show achievement growth from homework. (CCL, 2009) Most studies of elementary students do not show an increase in achievement due to homework. (Cooper, 2006)

What does homework require to be most effective?

  • Active Learning: Homework that required rote repetition and memorization did not benefit students as well as homework that required deeper thought and active learning. (CCL, 2009)
  • Time Limit: Less than one hour a night showed positive achievement growth.  More than two hours a night did not show an increase in achievement. (CCL, 2009) More than seven hours a week in homework showed lower test scores. (Eren, 2011)
  • Effort: Student effort on homework is more directly linked to achievement than time spent on homework.  (Trautwein, 2007)
  • Math Content: Math homework has a greater effect on student achievement than in English, history and science. (Eren, 2011)

The Changes

Having read through many studies and articles, I am convinced that homework is still something I should be having my students do. But I need to make some changes to how I approach it! I wrote some rules for myself:

Rule 1: Don’t blindly assign homework problems from out of the book. Textbook problems tend to focus on repetition and memorization. They do not often require students to think deeply or engage in active learning.

Rule 2: Assign fewer problems but make sure they are more challenging and require reasoning and conceptual understanding. Effort matters more than time spent! Short but still challenging problems could accomplish this. My initial thought is to assign no more than 5-7 problems per assignment. If a student can do 5 problems correctly, who am I to make them do 20 problems? See Dave Coffey’s post on a great way to spice up a boring worksheet.

Rule 3: Incorporate problem solving into weekly or biweekly assignments. See Fawn Nguyen’s post for further elaboration.

Rule 4: Encourage a love and appreciation for math by allowing students to explore math’s applications in art, games, puzzles, etc. I am going to try using Math Munch. Again, see one of Fawn Nguyen’s post. (She’s awesome!)

Rule 5: Find a way to give additional homework support to disadvantaged students, students with lower ability, and students with parents with lower educations. My initial thought is to offer specific homework lab times during lunch or after school.

I am sure I will come up with many more rules for myself as I go, but I thought this was a good start! While this may not solve all of my issues with time spent on homework in class, I am hoping that assigning fewer problems will save me a lot of time. I’ll try to keep you updated as I go!

References

Canadian Council on Learning (2009). Homework helps, but not always: Lessons in learning. Canadian Council on Learning, 1-9.

Cooper, H., Robinson, J., & Patall, A. (2006). Does homework improve academic achievement? A systematic synthesis of research, 1987-2003. Review of Educational Research, 76 (1), 1-62.

Eren, O., & Henderson, D. (2011). Are we wasting our children’s time by giving them more homework? Economics of Education Review, 30 (5), 950-961.

Ronning, M. (2011). Who benefits from homework assignments? Economics of Education Review, 10, 55-64.

Trautwein, U. (2007). The homework-achievement relation reconsidered: Differentiating homework time, homework frequency, and homework effort. Learning and Instruction, 17, 372-388.
Geometry Unit – Similar Solids

For this lesson, we are investigating the effect of a scale factor, k, on the surface area and volume of similar solids.

We started by reviewing similar figures.  We recalled that they had to have proportional sides.  I also reminded them that if we knew the scale factor or the ratio of the sides, we could use that to find missing side lengths.  I then introduced the idea that 3D solids could also be similar.  We brainstormed to come up with examples that we had seen.  The list included different spheres like a basketball and a golf ball, different size soup cans, and gift boxes.  I wondered aloud to the students (I do that a lot!), “I wonder if there is a relationship between the surface areas and volumes of a similar solid.”  I let the students think about it for a minute and then we got started.

I put students in groups of four. I gave them each a worksheet a couple handfuls of wooden cubes. Having at least 64 blocks per group is helpful but they can share if necessary.  The worksheet I created can be found here.  Students created different cubes that were proportional using the wooden blocks.  They calculated the surface area and volume for each solid. They should find that if the side length ratio is a:b, then the ratio of the surface areas is a²:b² and the ratio of the volumes is a³:b³.

Using the tables in the worksheet, they were able to easily compare the ratios of the side lengths, surface areas and volumes of the similar solids.  Some groups needed to reduce their ratios to see the pattern but they were able to pick it up after that. Students discussed their results with the class. Because they discovered the properties on their own, I feel students will remember the relationship longer and have a deeper understanding. They also take ownership of their learning when they discover it on their own.

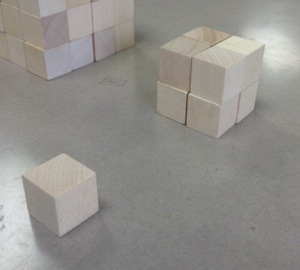
Below you can see how students formed the cubes they used to complete their investigation.

20140331-220843.jpg

20140331-220856.jpg

20140331-220906.jpg

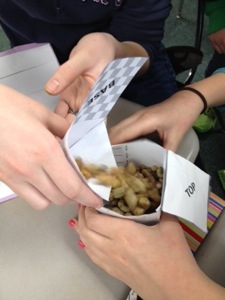
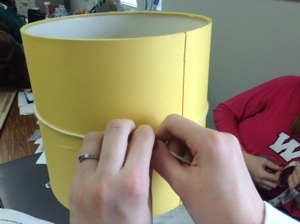
After working on this concept for a few days, we did an AWESOME extension activity that I read about from Jill Knaus, a fellow math teacher and grad student.  You can find her post here.  You can read about it here.  I gave each group a disposable coffee cup and asked them to figure out how much coffee was inside the coffee cup in the picture below and how much paper would it take to make the cup?  It was a lot of fun!

Picture

Geometry Unit – Volume Formulas for 3D Solids: Pyramids and Cones

In this activity, students will discover the relationship between the volumes of cylinders and cones, and prisms and pyramids.  The previous day students had discovered and written the volume formulas for prisms and cylinders. Read more about that activity here. We will use that knowledge to help us write our formulas for the volume of a cone and a pyramid. We also had previously made a rectangular prism, a rectangular pyramid, a cylinder and a cone from nets.  I used nets that came from an AIMS book.  The nets have been really helpful!

I began by asking the students what their prisms and pyramids had in common.  What did they notice about them?  We did the same with the cylinders and the cones.  Students noticed they were the same height and that they had the same bases.  I asked the students what they thought the relationship between the volumes would be. Would they be related? Students made conjectures in their groups.

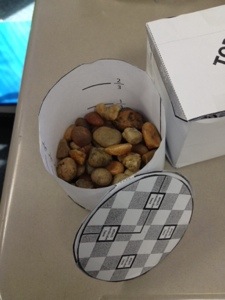
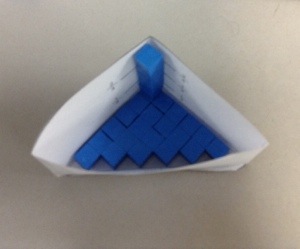
Each group was given a cup of small stones to test their theories with their 3D solids.  The nets have important measurements and fractions marked on them, so students could see very clearly that the volume of the pyramid was 1/3 the volume of the prism.

20140325-210848.jpg20140325-210815.jpg

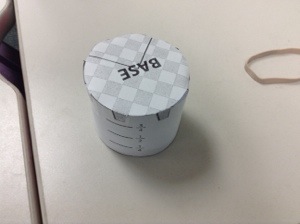
We did the same thing with the cones and cylinders.

20140325-210942.jpg20140325-210919.jpg

Once the relationship was found, I asked students to write volume formulas for the pyramid and the cone.  All groups were able to write their own without help from a teacher. A huge victory for me! In the end we came up with…

Volume of a Pyramid:  V= 1/3Bh, where B is the area of the base and h is the height of the pyramid.

Volume of a Cone:  V = 1/3πr²h, where r is the radius of the base and h is the height of the cone.

Again, having the students discover their own formulas helps them remember them better.  Also, they have a deep understanding of where they came from which is always helpful! A great challenge to give students once they have the formulas is to ask them to find the volume of a pyramid or cone but give them the slant height instead.  This forces them to use the Pythagorean Theorem to find the height they actually need! I love bringing past material up again!

Geometry Unit – Volume Formulas for 3D Solids: Prisms and Cylinders

We’re working on finding the volume of 3D solids this week. I am not too concerned with my students having the formulas memorized, but instead I want them to understand why the formula makes sense. So we spent a class period finding the volume for some 3D solids without using a formula. After that we generalized to write a formula that we came up with ourselves.

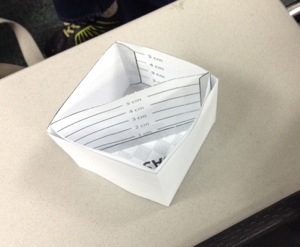
The previous day, we cut out nets for a rectangular prism, a triangular prism, and a cylinder. For this lesson we assembled the nets so they formed the solids. I used nets from an AIMS workbook, Measurement of Prisms, Pyramids, Cylinders and Cones. You can purchase it here. I really like their nets because if you enlarge them 103% then centimeter cubes will fit perfectly inside. Also, some helpful measurements are marked inside the solid.

After assembling the nets, I asked the class, “How many centimeter cubes will fit inside the rectangular prism.” That was the only question I asked. I did not give them any instruction on how to find the answer.  Within about 30 seconds, students were asking if they could have some centimeter cubes so I gave each group a handful of cubes and let them work. They did not have enough cubes to fill up the prism so they had to figure out a way to do it without actually filling it completely.

Students used various methods to solve but most filled in the bottom with cubes to create a first layer. Then they decided how many more layers they would need by stacking cubes until they got to the top of the prism.

20140320-084452.jpg

20140320-084435.jpg

When students finished the rectangular prism, I asked the to figure out how many cubes would fit in their triangular prism. This was more challenging since they couldn’t fit the exact amount of cubes in the bottom of the prism. But they used similar methods once they figured out the base area.

20140320-084506.jpg

I really liked the approach this student used! They compared the triangular prism to the rectangular prism and saw it was half. So half of the cubes could fit in the triangular prism that fit in the rectangular prism.

20140320-084425.jpg

Lastly! I challenged students to find how many cubes would fit in their cylinders. I was really impressed with how many students were able to come up with this without help! They talked in their groups about how they need to figure out how many would be in the bottom. They figured out the radius and then used A= π² to find the area of the base. They then multiplied it by the height of the cylinder which they found by stacking the cubes.

20140324-105153.jpg

We discussed all of our answers as a class. I asked groups to describe how they found their answers. They considered what we had done for each prism and then generalized to write a volume formula that would work for all prisms:

VB × h, where B = area of the base and h = height of the prism.

We discussed how we could use that same formula for the volume of a cylinder but since we know the base will always be a circle we can use π² instead of B. The volume of a cylinder can be written as:

V = π²h, where r = radius of the circle and h = height of the cylinder.

I was really happy my students were able to come up with the formulas on their own, especially the volume of a cylinder.  Some of my students who tend to struggle in math were the first to figure it out! That was really fun to watch!

Geometry Unit – Circumference and Area of a Circle

Last week we spent some time working with circles. All of those snow days helped me out because it fell perfectly in line with Pi Day this year! We began by investigating the relationship between circumference and diameter. I used materials made by Illuminations. They can be found here.
We talked about the importance of measuring with precision. We also talked about making sure you get as close to the diameter as possible. I split the students in groups and let them walk around the room to find circular objects to measure. I had many objects set out but I also let them look for others.
20140318-170328.jpg
20140318-170250.jpg
20140318-170229.jpg

After the groups completed their tables, they averaged the ratios they calculated. As a class we also averaged the group results and came up with 3.24.
20140318-175859.jpg
I asked the groups to discuss what they noticed about all of the ratios. They all noticed the ratios were around 3-3.5. Most groups quickly realized that the ratio was pi. Each group was instructed to then write an equation relating circumference, diameter and pi. Discussing all the variations of the equation was really helpful. It allowed students to see that we could use it to solve for the diameter or the circumference.

After we found the formula for the circumference of a circle, we went on to the area of a circle. Throughout this unit we have been cutting shapes to rearrange them into different shapes that we know the area formulas for. You can see more on that in my previous post.

We started with a circle that was divided in to 12 equal sections. We cut the 12th section in to two parts and labeled them a and b.
20140318-170114.jpg

We cut out the segments and rearranged them so they formed a shape that looked somewhat like a rectangle. The students were very quick to point out that the shape was not a rectangle. We discussed what would happen if we continued to cut the segments smaller and smaller. What would the shape look like then. We concluded that it would become closer to a rectangle as we continued to cut so it was ok to use the rectangle area formula.
20140318-170101.jpg
Students decided that the height of the rectangle would be the radius. The base of the rectangle took a little more thought, but I was really impressed that they were able to see on their own that it was half the circumference or 1/2(2πr). We simplified so the base of the rectangle equals π×r, making the area of the rectangle equal to π×r×r or πr². The students thought that was really awesome, as did I! Very rarely is the derivation of the area of a circle taught.  This is my first time teaching it, I’m embarrassed to say. But it went really well, and I will definitely use it from now on! All credit goes to my teacher assistant, Dominic Taylor, for finding it! Check out his blog at dataylor92.wordpress.com!

Geometry Unit – Interior Angles of a Polygon

Whenever I teach a theorem, I always prefer to lead my students to discover it on their own.  I’d like for them to not only know the theorem and how to use it, but also where it comes from.  This week, my seventh grade students were working on discovering the sum of the interior angles of a polygon.  It’s a pretty straight forward theorem so the worksheet I created is also pretty simple.  Students could easily find the theorem without a worksheet.  I created it to add structure because my students still need that, but eventually I would prefer if they could do something like this with less of my input.  A nice extension activity would be to have students investigate the sum of the exterior angles.

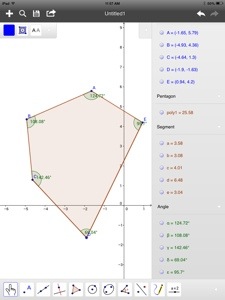
In years past, I have had students draw the polygons and measure the angles with a protractor.  This year I was able to check out a classroom set of laptops so we used GeoGebra.  Helpful GeoGebra tip: To get the interior angles displayed, you must create your polygon by plotting points counterclockwise. Then select the angle icon from the menu and click inside the polygon.  If you build your polygon clockwise, the exterior angles will be shown.  Some student work is shown below:

20140303-200427.jpg

20140303-200448.jpg

20140303-200501.jpg

20140303-200517.jpg

Geometry Unit – Area Formulas for Polygons

I find that by 7th grade, students can generally rattle off a few area formulas like base x height and half base x height and so on. Often times times they mix up which polygon the formula goes with. And rarely do I think students know where the formula came from. I always prefer my students know HOW to find a formula over actually knowing the formula itself. If we’re lucky, teaching where the formula comes from might accomplish both!

Warm up

Students cut out 1 rectangle, 1 triangle, 1 parallelogram, and 2 congruent trapezoids from graph paper. I ask them to make the bases and heights whole numbers. Also, you may want to cover how to make sure their parallelogram has parallel slant sides.

Deriving the Formulas

I spent some time with my 7th graders talking about how to find the area of a polygon. We started with the basics, a rectangle. But instead of asking for the formula, I asked them how they would tell a 1st grader who couldn’t multiply to find the area of the rectangle they had cut out. After hearing all the responses, then I asked the students how they, a 7th grader, would find the area. They were all very sure the area equals base times height, A=b x h. Once we had that down, we could work on the other polygons.

20140225-204906.jpg

Our goal was to turn the remaining polygons into a shape that we already had an area formula for, like a rectangle. We next looked at our triangles. Students should label the base and height on their shape.

20140225-204920.jpg

Students can cut the triangles, but the area doesn’t change. So once the triangles are cut, they can be reconfigured to be a rectangle with half the height and the same base as the original, or vice versa. Some triangles are much easier to make into a rectangles, like a right or isosceles triangle, but you can still make it work with any triangle as can be seen in the pictures below. Once the rectangles were formed, we wrote out the area formula for each triangle and found it would always be 1/2 b x h.

20140225-204935.jpg

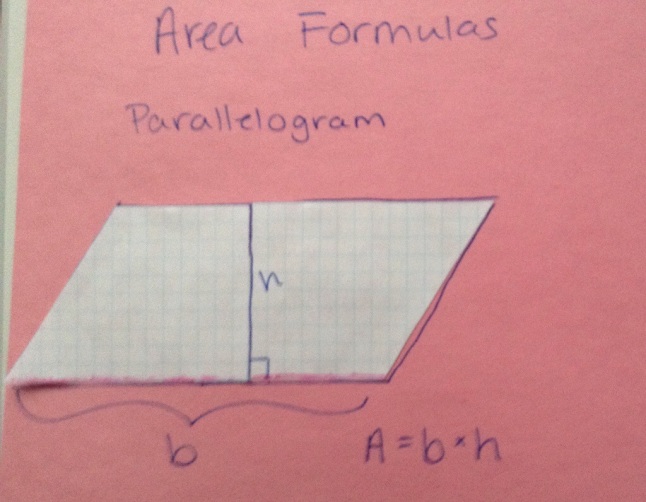
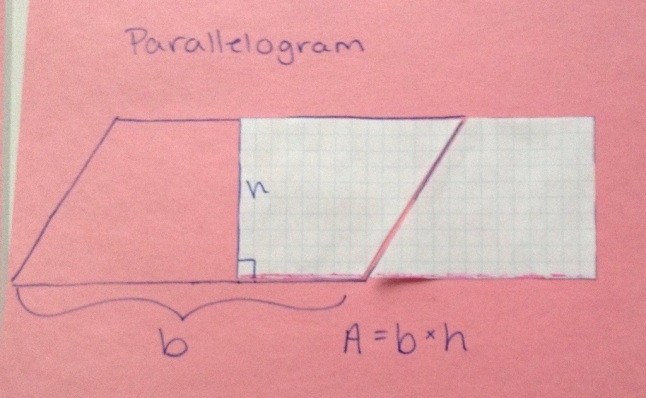
Next we moved on to parallelogram which is pretty straightforward. I asked the students to cut along the height and then to try to rearrange the shapes into a rectangle. They got it pretty quickly. They also recognized that the dimensions of the new rectangle were the same as those of the parallelogram so again the area was equal to b x h.

20140225-204954.jpg

20140225-205005.jpg

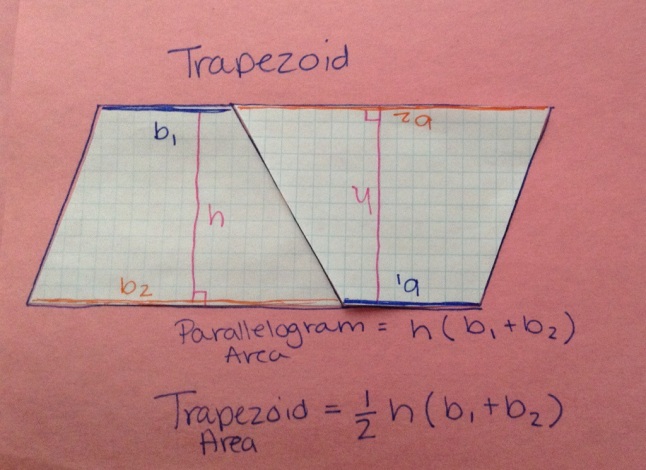
Last but not least, we got to the trapezoid, the trickiest of the all! You can cut a trapezoid into pieces that will form a rectangle but it is definitely harder to walk the students through. So instead we used the formula for the area of a parallelogram. I asked students to arrange their two congruent trapezoids into a shape we knew the area for.

20140225-205025.jpg

I didn’t tell them to make a parallelogram but they figured it out. We wrote out the area for the parallelogram we made. From there, it was easy to see the area of the trapezoid was half of that, thus…

20140225-205035.jpg

And ta-da! We’ve found the formulas for the area of a rectangle, triangle, parallelogram, and trapezoid!